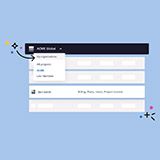
In April, we introduced our shiny new management console, a long-time effort meant to provide you with a clean and intuitive interface to interact with and manage your projects.
We're proud of what we've done so far, but it's a software project like any other after all—always evolving behind the scenes. In that same announcement, we told you more would be coming to the console. So today, we're happy to announce the brand new Services Page, giving you access to more information about your services, for every environment, right from your management console.
The Services Page
The new management console exposed new information about every one of your environments. You could view every push, whether you were using the project as your primary remote repository or mirroring an existing remote using an integration. Each backup was available for restore, and you could access fine-grained control over how an environment inherits its variables and user access permissions from its parent.
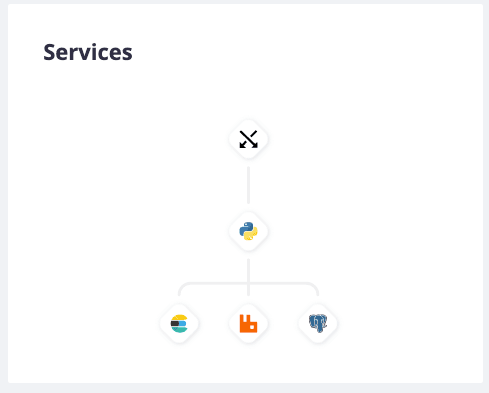
One of the newer features packaged with the new console was our Service Graph. The Graph was always meant to provide a high-level picture of your cluster, so that you could see how each of your containers related to and communicated with each other at a glance. We want to provide more information about your applications, about your codebase and its configuration on Platform.sh, directly visible in the console, and this was a first step toward doing that.
The Services Page provides even more information about each of your containers. But first, let's clarify what we mean by services. At Platform.sh, despite the fact that we provide managed services like MariaDB and Elasticsearch that can be easily added to a project and configured as part of your cluster, there’s little difference, in principle, between a runtime, a service, or a route container. Because of this, we’ll often refer to any container in a cluster—including each application container you create—as a service container. That's why we called it a Service Graph, and now, the Services Page.
At the top of the page within each Platform.sh environment, you'll see a new tab labeled "Services." Selecting that tab will introduce you to a whole new area of information about how your routes, services, and applications are currently configured for the environment. Each of your application, service, and route containers are visible both in the same Service Graph on the Overview page and as a list. Selecting an individual container will provide more information about that container.
Routes
The router container is the first listed in both the tree and list view of your environment.
From here, you’ll be able to view information about each route configured in your routes.yaml file. Each redirect and upstream route is listed, along with its caching behavior, and its Server Side Includes settings.
Applications
Each application container in the environment is also available from the Services Tab.
The first "Overview" section gives you some metadata information regarding each application. This section will tell you the size of the app container, the amount of persistent disk you have allocated for it, the number of active workers and cron jobs, as well as the command to ssh into that container.
You can then select the "Crons" tab to see more information about the application's cron jobs.
You'll be able to view its status, the last time it was run, and the command itself. Finally, the "Configuration" tab provides a summary of that application's configuration, pulled from your .platform.app.yaml file.
Services
Each service container in the environment is listed after your applications. The "Overview" tab lets you view how much disk, if any, has been allocated for the service, and the size of the container.
The "Configuration" tab lets you view some of the configuration information for the service container, pulled straight from your services.yaml file.
At Platform.sh, we want to make the management console a key resource in your development workflow by adding features that enable you to easily observe and test your configurations as they develop.
For teams of developers, having more information front and center can help to keep everyone on the same page. Solo operations aren't lost on that benefit, either, because the console can become just as much of a reference for how your application works as the codebase itself. Change your configuration when you need to and observe its effects straight away. Otherwise, view it at a glance, and get on with innovating your applications.
Every feature we release for the console has this in mind, so stay tuned for what's to come. This is, as they say, only the beginning.
 Switching to Platform.sh can help IT/DevOps organizations drive 219% ROI
 Organizations, the ultimate way to manage your users and projects


