 Switching to Platform.sh can help IT/DevOps organizations drive 219% ROI
 Organizations, the ultimate way to manage your users and projects
Observability Suite
Platform.sh all-included package for performance management
From Application Performance Management to Auto-Scaling, the Observability Suite will give you all the tools to make your applications more performant, scalable and efficient.
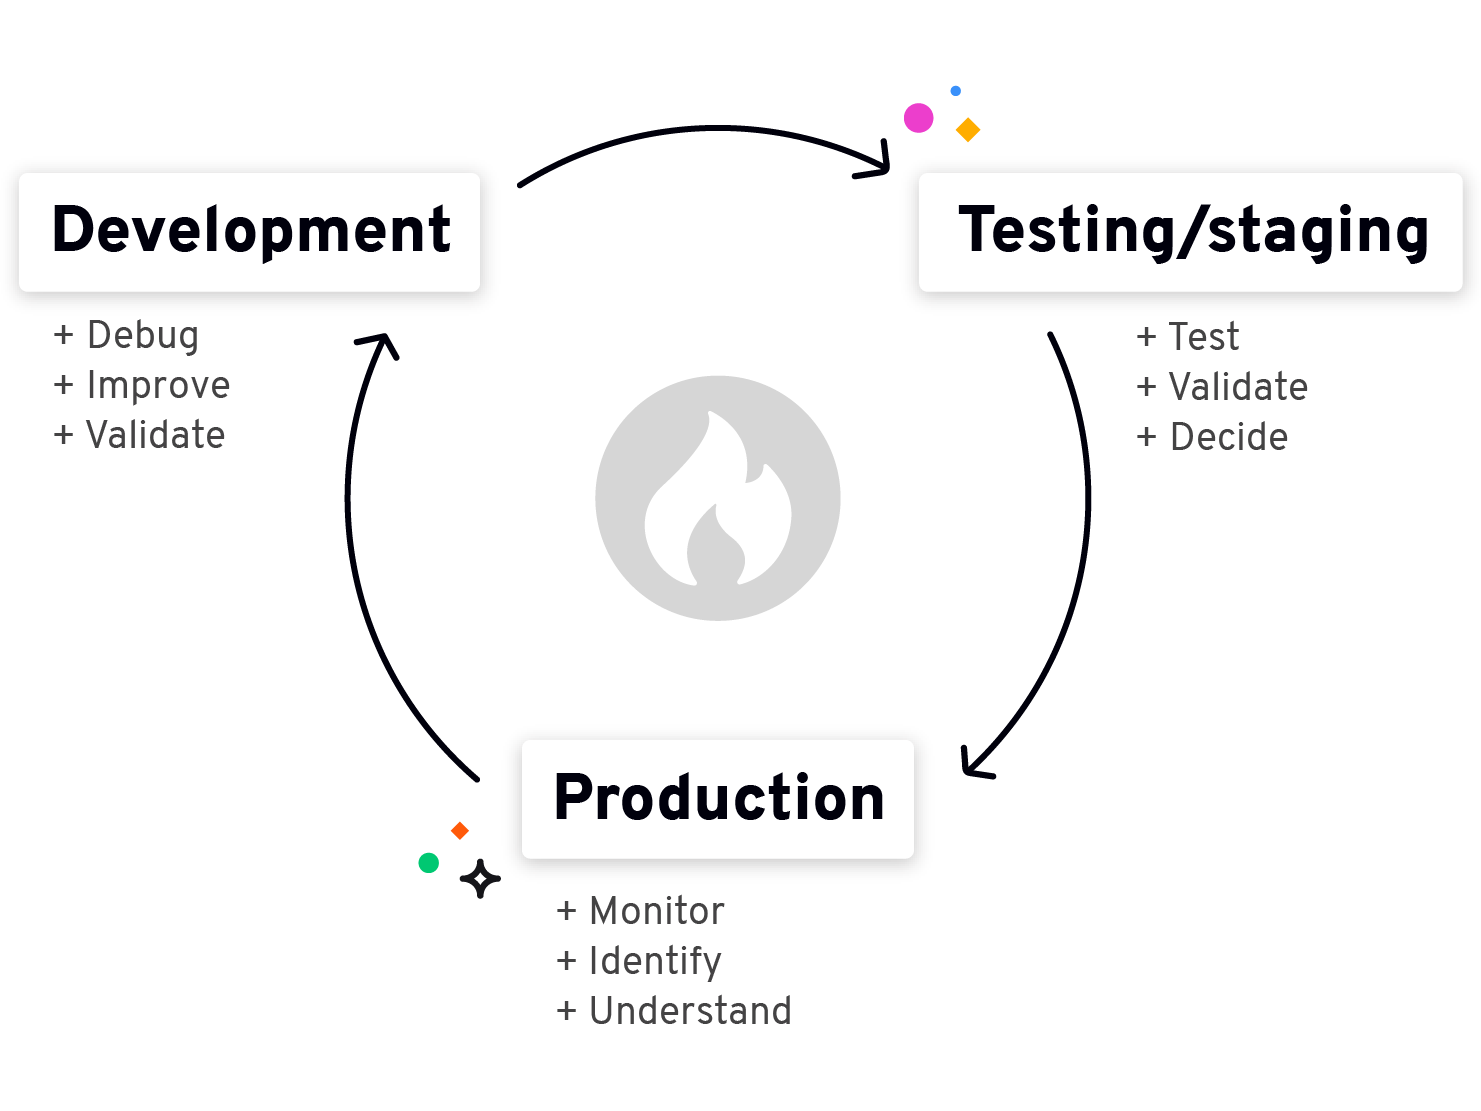
Observability from Development to Production
Monitor, profile and test your application even before it is released in production. Get actionable insights to improve your code rather than spend time figuring out what’s wrong. Ensure optimal performance and user experience for your applications. Application observability has never been easier.
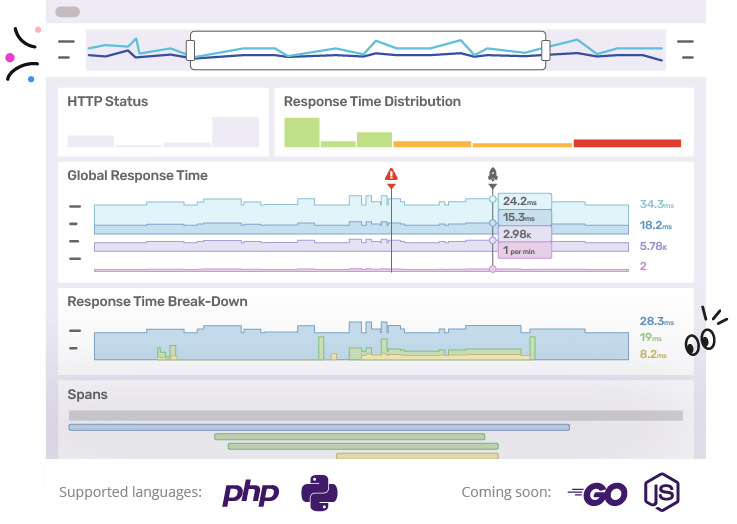
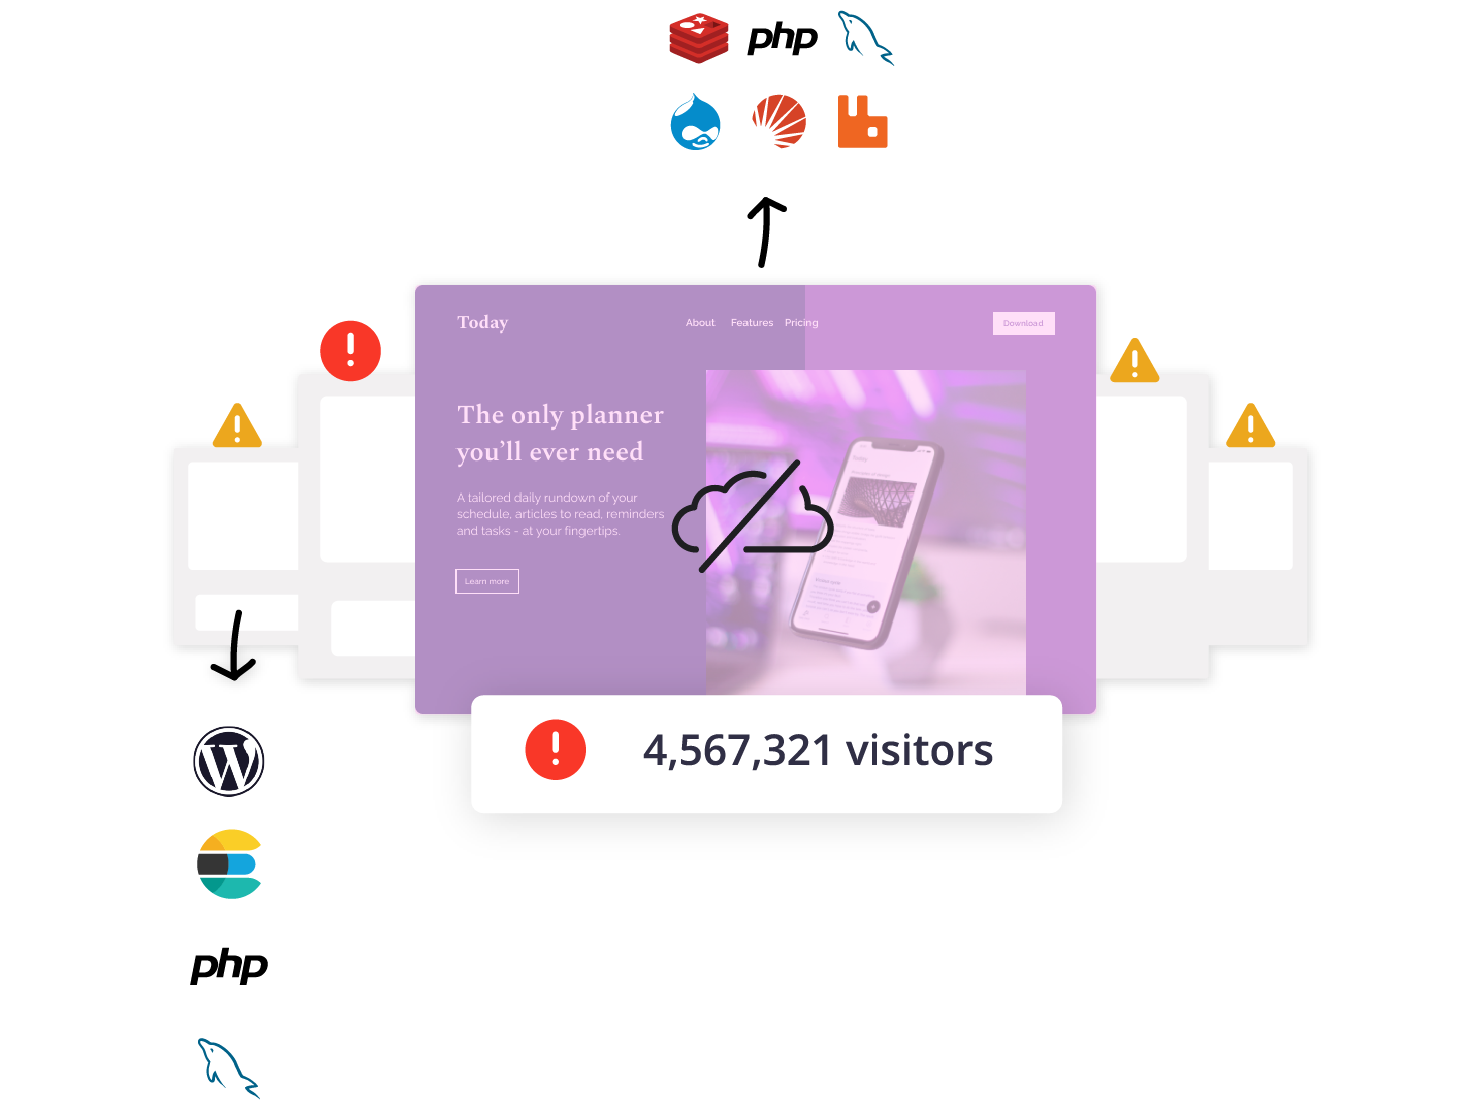
Fully-fledged Application Performance Monitoring
Figures on how your application performs in production. Monitor server-side response time and memory usage. Drill-down and find bottlenecks in transactions and service calls (SQL, HTTP, queues,...).
Let Blackfire automatically profile key transactions and obtain unrivalled visibility in your code’s behaviour and get alerted when something goes wrong with our observability platform.
Explore a live demo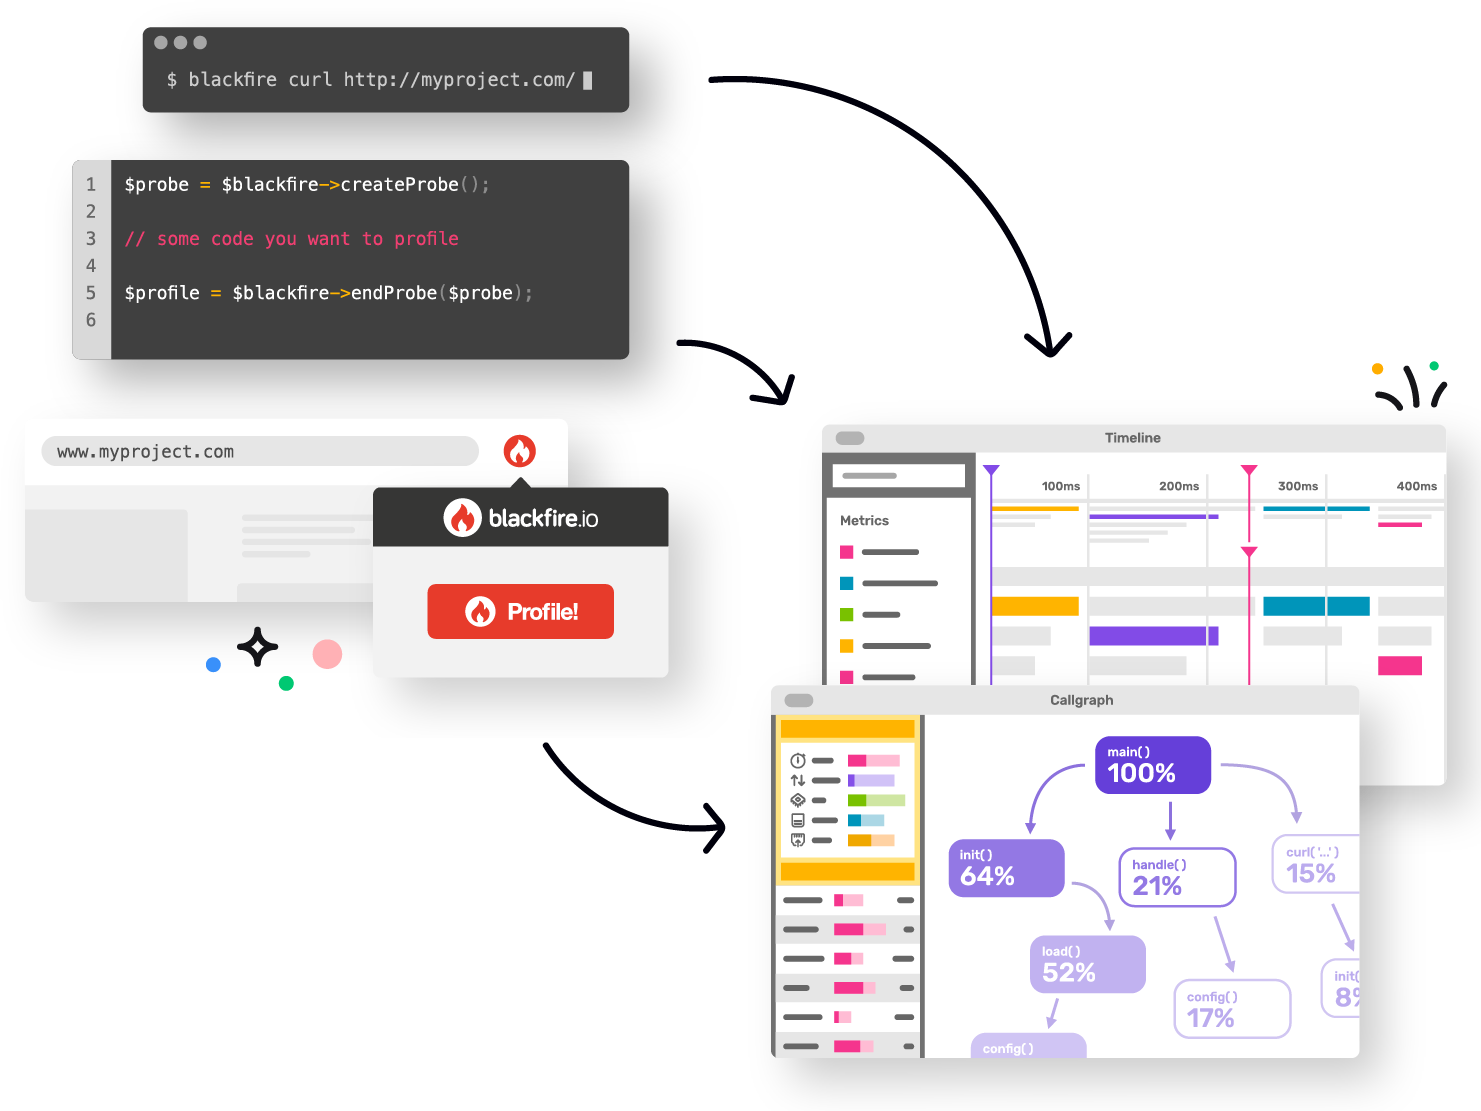
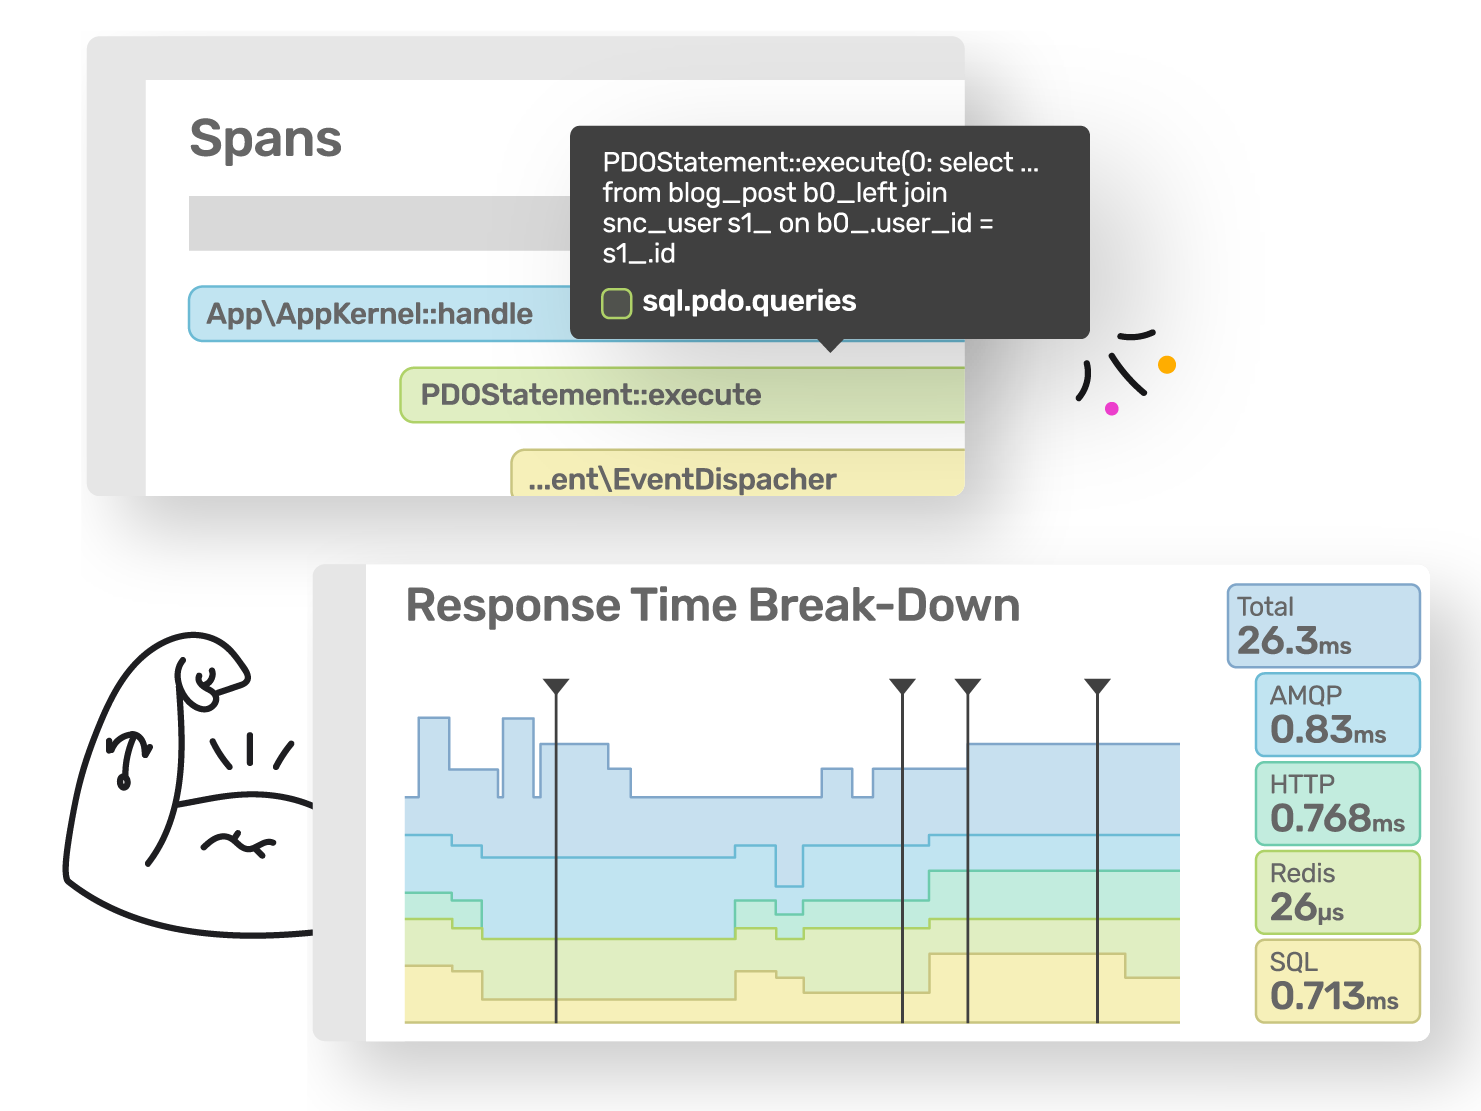
In depth profiling of your application code
Blackfire's unique profiling technology collect function-call-level metrics that let developers understand exactly how their code behaves. Through time-sequence and behavioral visualizations, analyse how code consumes time, memory and network. Find slow SQL queries and HTTP requests.
Collect such metrics from your live production site, then reproduce measurements on local machines. Iterate and compare iterations to validate code changes.
Auto-Scaling
Auto-Scaling is available on all Enterprise Dedicated clusters running with the Observability Suite - out of the box, no configuration needed.
Anytime your site begins to experience errors due to increased resource consumption, our orchestration system will automatically double the resources of your production environment in minutes, providing consistent auto-scaling performance.
Learn more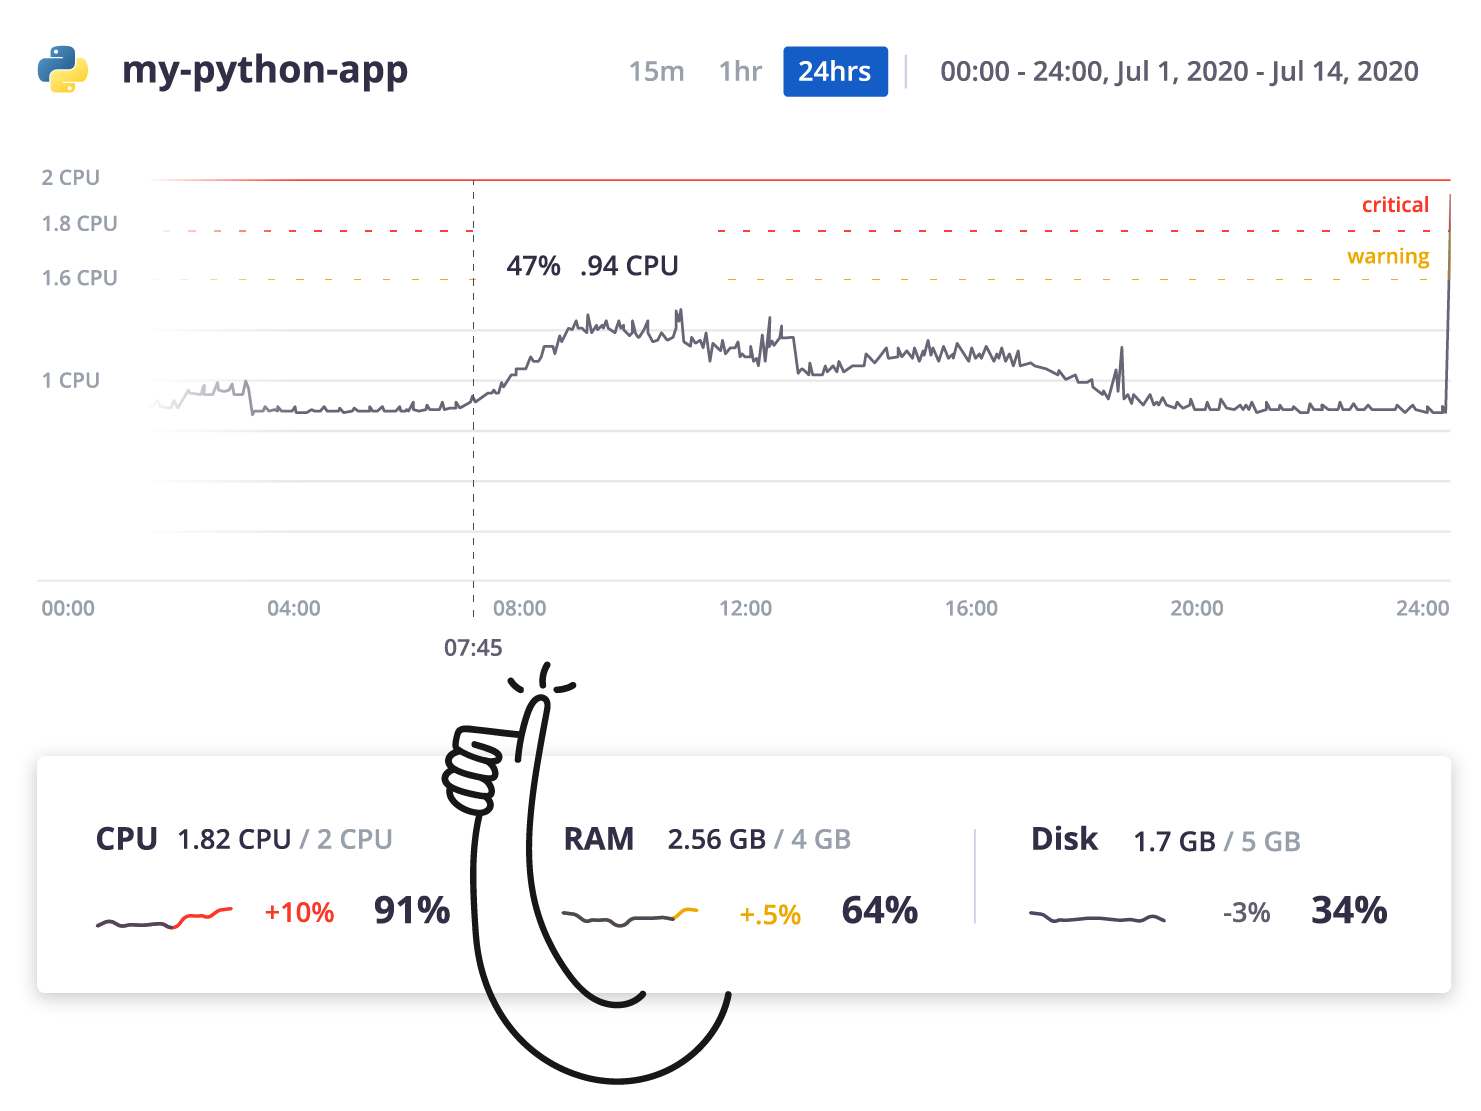
Infrastructure metrics
Get a real-time view of your applications and services resources usage. Track CPU, memory and disk usage over all your containers.
Identify and monitor bottlenecks on any of your services on any of your running environments and get insights on when to upsize your projects to accomodate more traffic.
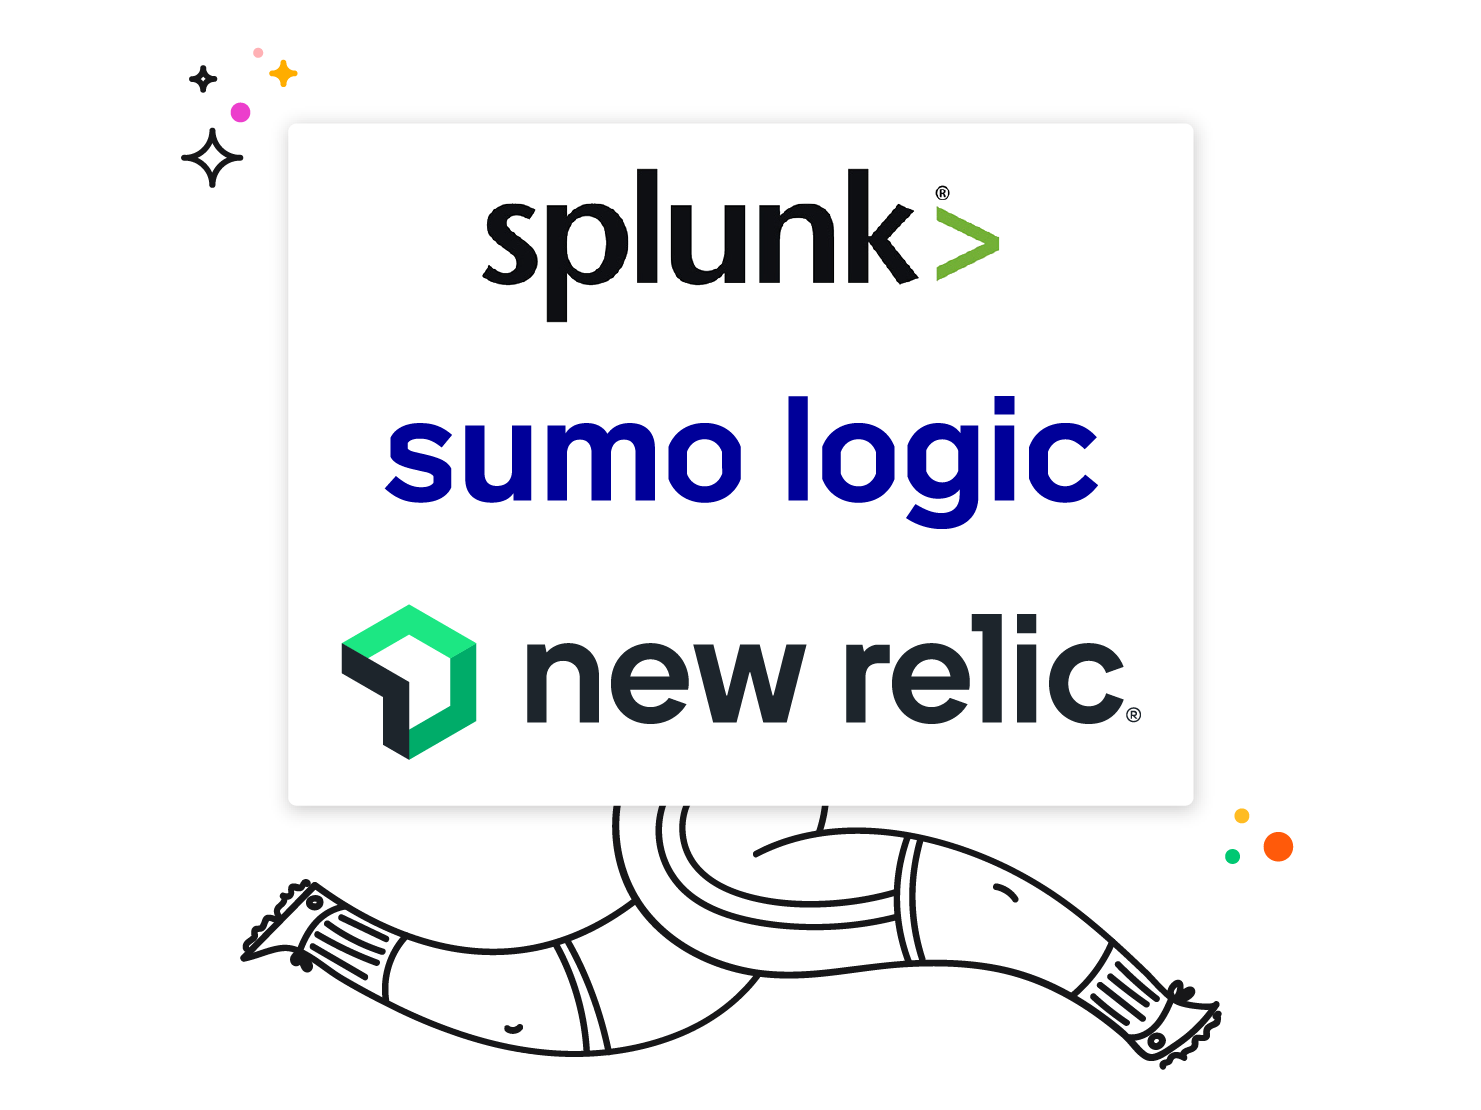
Logs forwarding
Ship your Platform.sh (applications and services) and Blackfire (agent and probe) log files to external 3rd party endpoints and services supporting syslog protocol.
Surface and identify issues on all your applications running on Platform.sh in a single log repository of your choice.
The supported external endpoints are:
- Splunk, New Relic & Sumologic on the Grid and Dedicated Generation 3 (both via CLI and from within the Console)
- Datadog, Loggly, LogDNA, Parpertrail & Logz.io on the Grid and Dedicated Generation 3 (both via CLI and from within the Console)
- Rsyslog on Dedicated Generation 2 (only via CLI)
Contact our Support or your Account Manager to help you to start forwarding logs for your projects
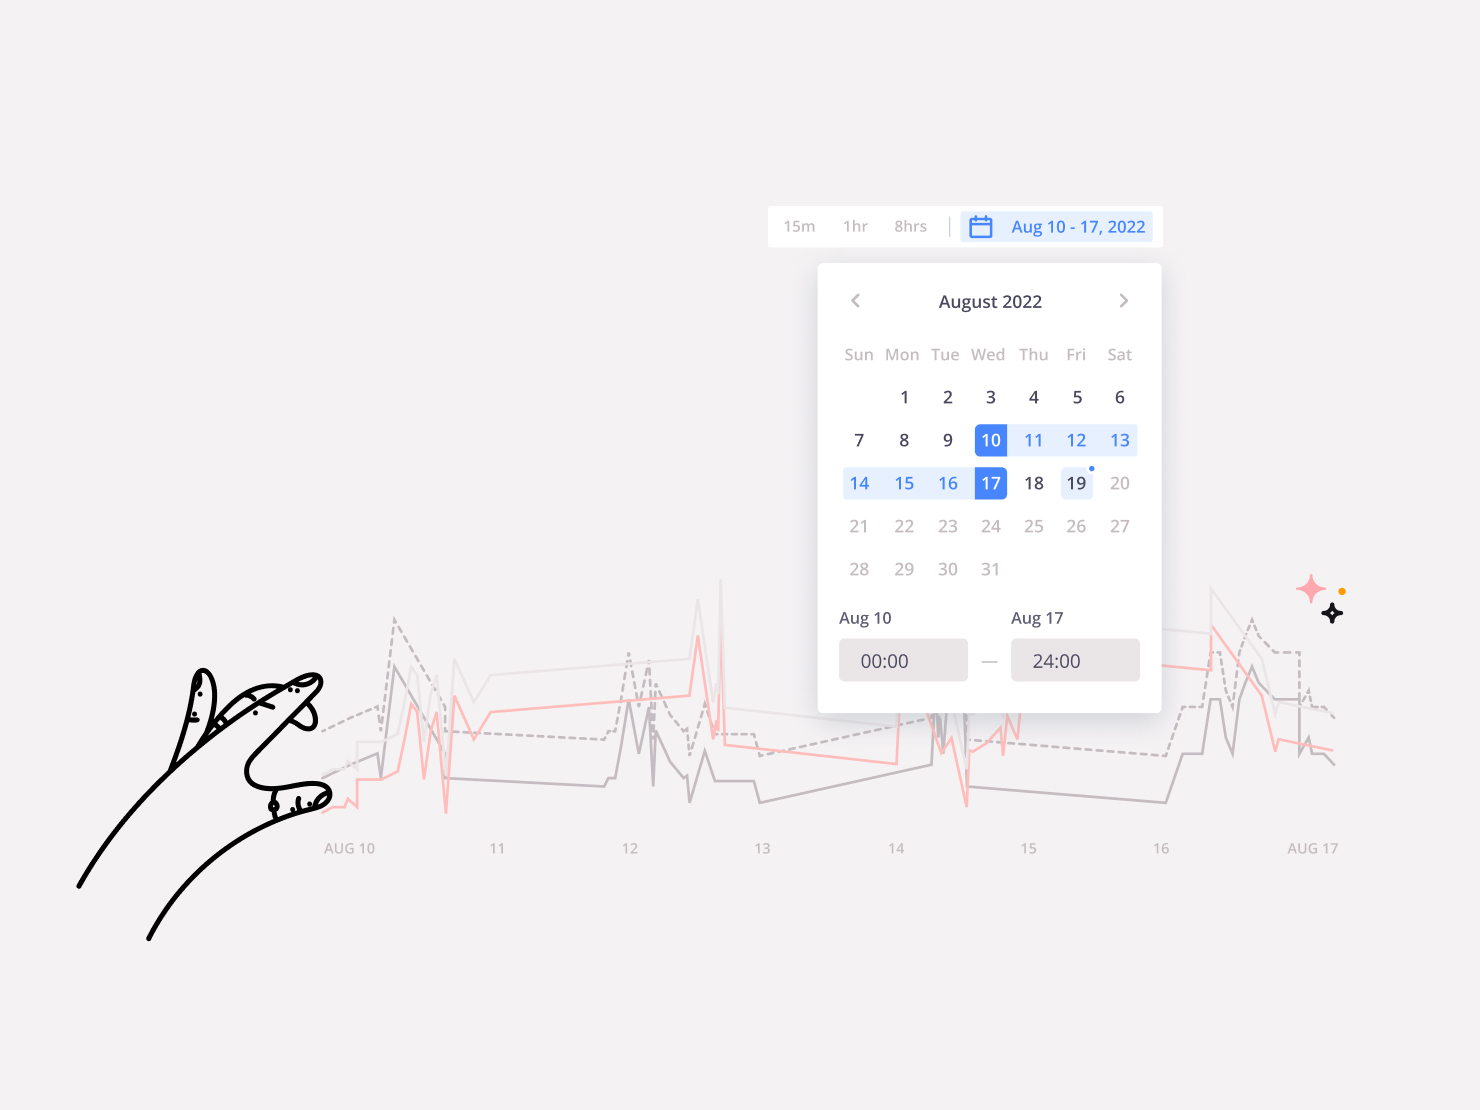
Longer Time Frames for Infra Metrics
Get extended look-back periods for your infrastructure metrics to a much longer time frame and access historical data for up to 30 days - with more to come in the future.
Make informed decisions around increasing and/or decreasing capacity, analyze various trends effortlessly, pinpoint anomalies, and optimzie your capacity planning with Platform.sh application observability.