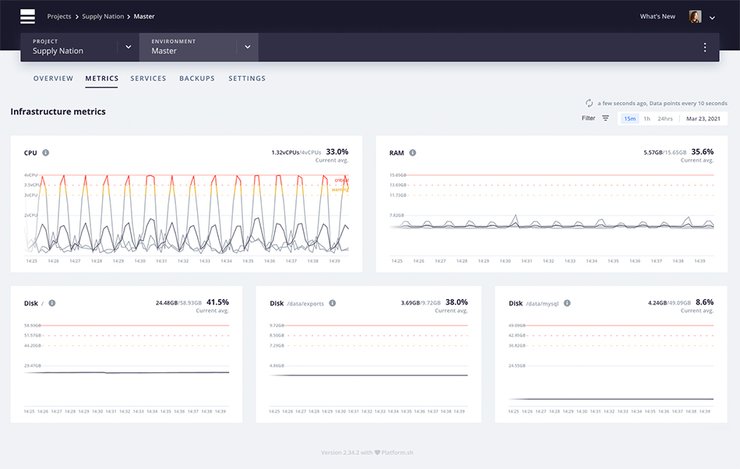
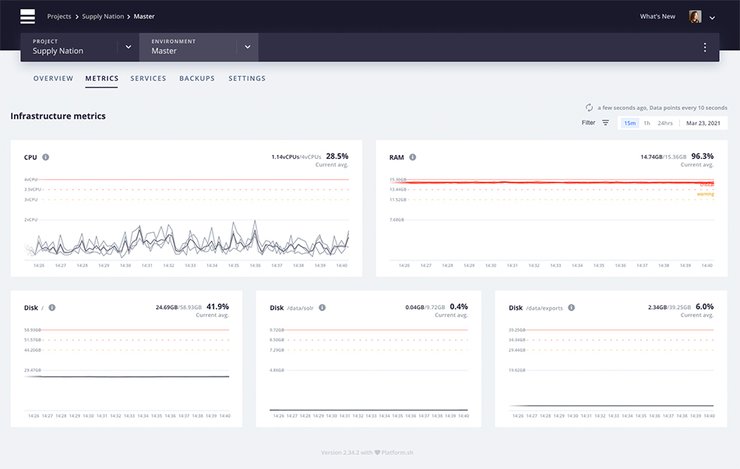
Running mission-critical web apps and sites comes with inherent operational challenges, but you can often avoid those challenges with informed planning. Just knowing the answers to simple questions—How much memory is being used by Host 2 right now? How close to the maximum amount of disk space did MySQL get yesterday?—can help you dodge common issues before they become problems.
To uncover the metrics to answer these simple questions, you may be using third-party tools you’ve cobbled together to monitor your Dedicated projects. But wouldn’t it be a lot easier if that information was already available on your projects themselves?
This week, we’re releasing a new feature on Dedicated infrastructure projects—metrics and observability. We’ve added a tab to the management console for your production environments that provides data-rich visualizations of your resource usage.
From this dashboard, you can view CPU, RAM, and disk usage across all of your hosts over the course of the last day and down to the individual measurement. Each metric also comes with utilization thresholds that let you know ahead of time if there’s a problem that requires investigation.
Starting today, all new Dedicated projects will have access to Infrastructure Metrics. And we’ll be rolling out the feature to all regions in the coming weeks. So check out the new solution on your project, follow along with our updated documentation, and feel free to contact us if you have any questions.
 Switching to Platform.sh can help IT/DevOps organizations drive 219% ROI
 Organizations, the ultimate way to manage your users and projects


