 Switching to Platform.sh can help IT/DevOps organizations drive 219% ROI
 Organizations, the ultimate way to manage your users and projects


The path to success in software development can be long and challenging. It requires a lot of skills and dedication as it’s not just about building applications, it’s so much more. It is also about being tailored for any situation, requiring us to be quick to adapt to change and to the unexpected.
It’s always worth giving yourself a head start to ensure you can react quickly to any situation and make educated decisions. This is precisely the purpose of Observability. It’s a holistic approach that lets you determine the current state of your application and how it behaves on the infrastructure it's running on. It provides mission-critical metrics and is operating as a watchtower overseeing your projects no matter how big or small, from a single application to a fleet.
After the release of Infrastructure Metrics and Observability for the Dedicated infrastructure projects, we are thrilled to announce the immediate availability of this feature for all environments of your Professional projects. A new Metrics tab will now be present on the environment level, to give you insight and visibility over your application, worker and service containers.
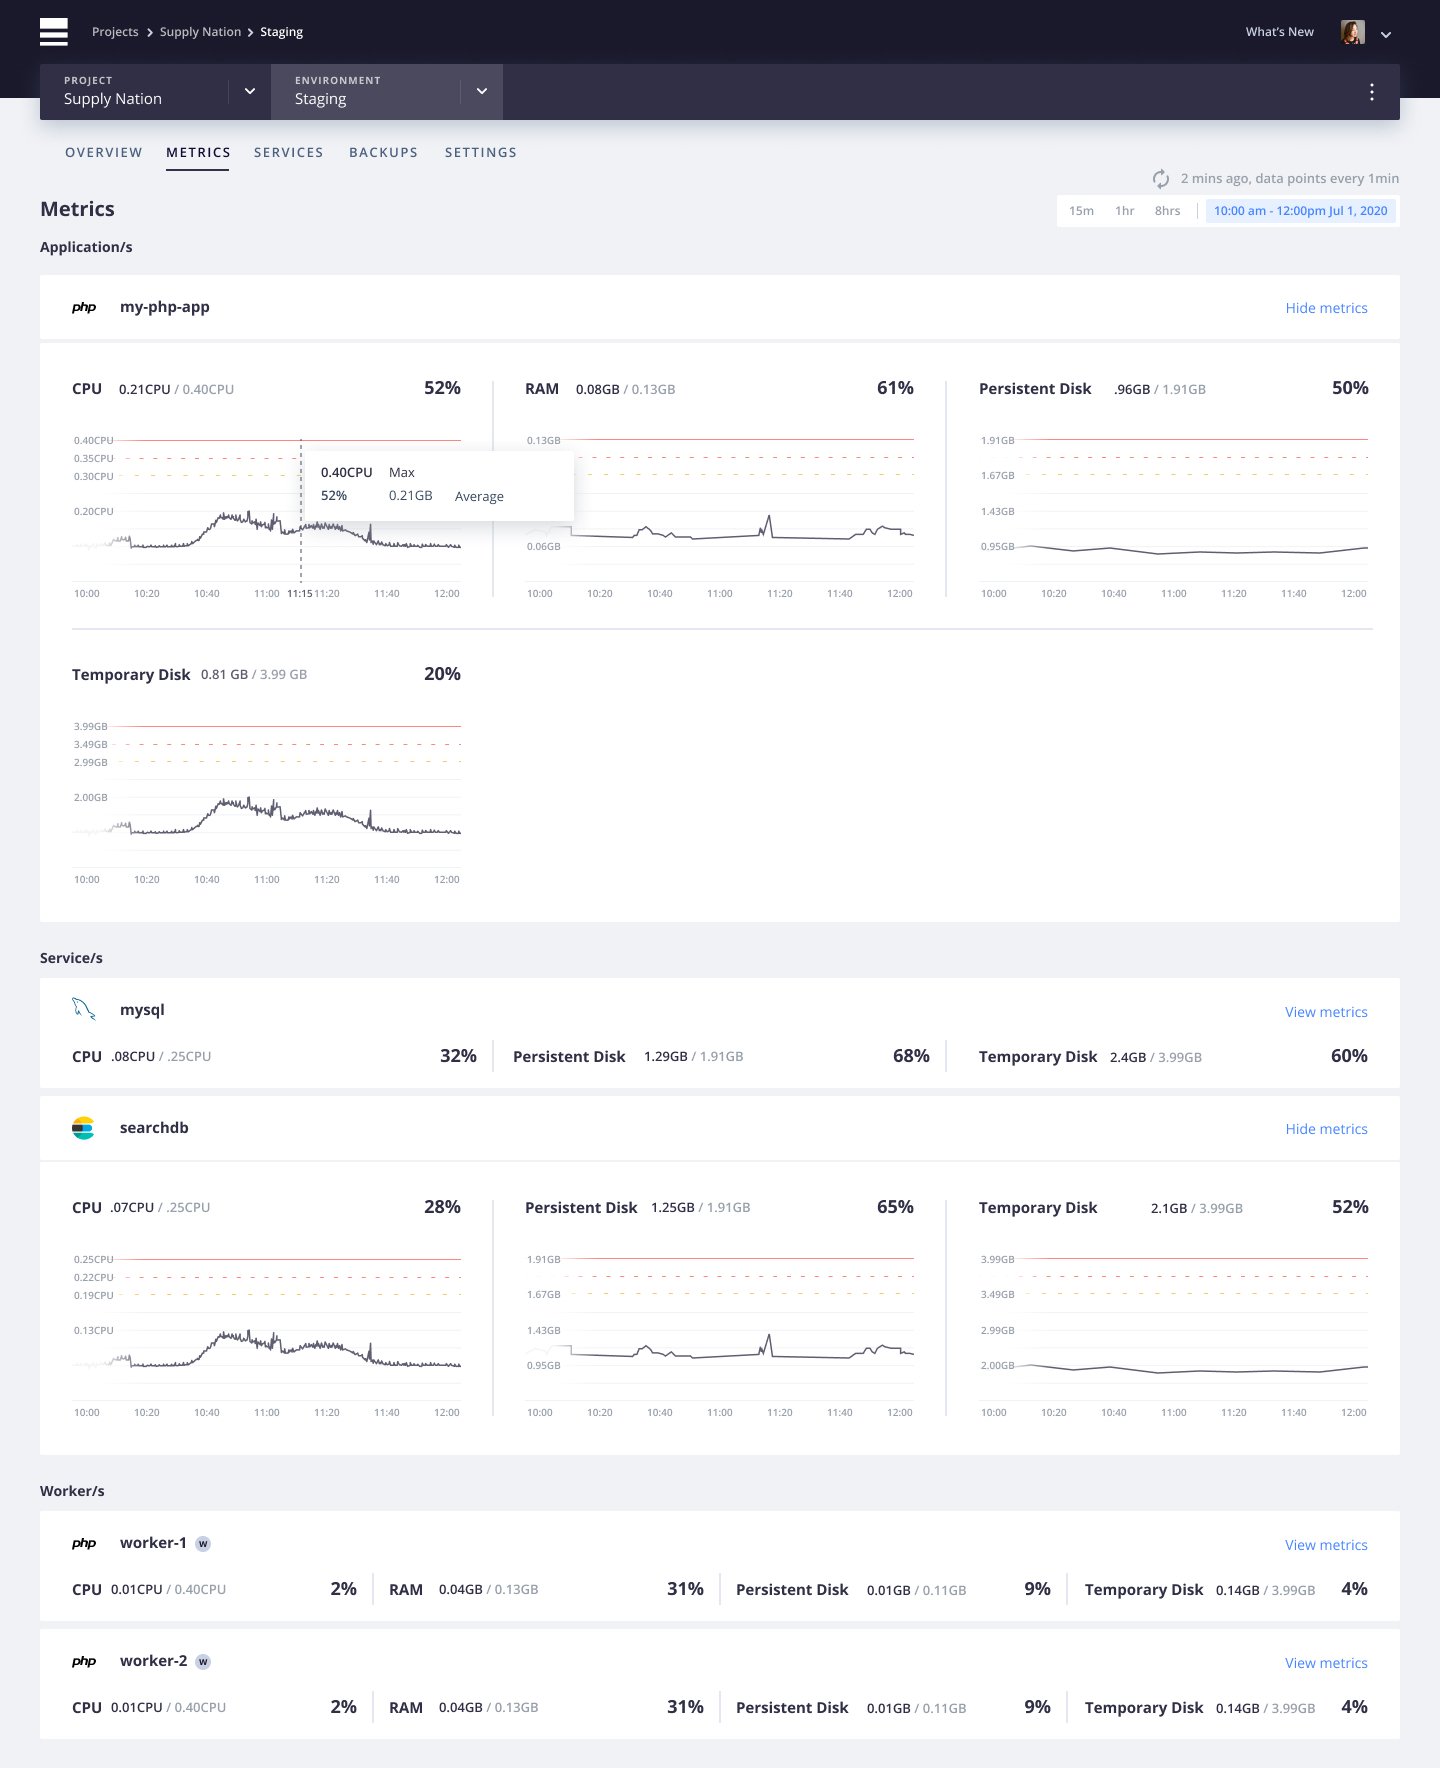
The specific metrics will be available for your environment:
- CPU, RAM, and Disk Space (persistent and temporary) metrics across your application and worker containers
- CPU and Disk Space (persistent and temporary) metrics across your Service containers
The utilization thresholds will help to identify any problems that require investigation over an 8hr time frame. This fine level of granularity leads to an improved understanding of the actual behavior of the infrastructure. It’s a step forward to putting ourselves in a situation where we can make educated decisions in no time, helping us to consider optimisations where they are needed the most.
Head over to your Projects in the management console to discover your environment Metrics and make sure to check out our updated documentation. Feel free to contact us if you have any questions or feedback on this unique feature.