 Switching to Platform.sh can help IT/DevOps organizations drive 219% ROI
 Organizations, the ultimate way to manage your users and projects


To make your life easier, we are open-sourcing our graphical analysis tool for Platform.sh PHP projects. Though written for our own needs at Pixelant, it should help you optimize your configuration and PHP code for Platform.sh.
The Platform.sh Log Analyzer tool runs locally, and we have tried to make it easy to install and run. It wraps around the platform CLI and generates a self-contained report as a single HTML file that you can view in you browser and distribute to your team.
After downloading the code, run php platformPhpAnalyzer.php from within the platformsh-analytics directory to get started. It will walk you through selecting the project and and environment to analyze.
Here are some of the ways the Pixelant team uses the log analyzer.

Mapping your memory usage
Too few PHP workers will lead to 503 errors. By knowing your app’s expected memory usage, you can maximize the number of concurrent requests by specifying PHP-FPM sizing hints in platform.app.yaml. For us, the default sizing hint of 45 MB was far above the 10–15 MB required for most of our TYPO3 CMS projects in PHP 7.x. (You will find details about memory hinting in the Platform.sh documentation.)
The PHP Analyzer’s Memory Usage graph helps you find the sweet spot. Our goal is to place 90 – 95% of all requests below the hinted memory usage threshold. Usage above the hint will cause swapping and slow down the scripts, but they will still work.
Memory usage
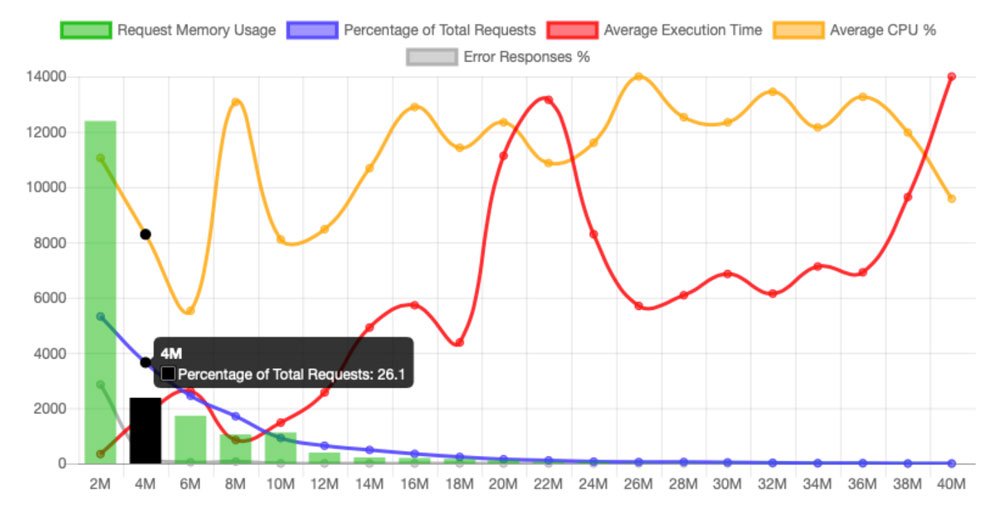
The green bars draw a histogram of the total number of requests for a specific memory usage. In this example, 60% of the requests use only 4 MB of memory. That’s a sign of a well-optimized site and the result of TYPO3’s excellent caching.
The blue line graph is the one to use to determine where to set the memory hinting. It shows the reverse cumulative percentage of total requests. In the illustration above, 26.1% of the requests (i.e., the requests to the right of the selected point) use more than 4M of memory. In this example, the sweet spot is around 12 MB (4.6%), so we set runtime.sizing_hints.request_memory: 12MB.
The red and yellow line graphs can help you spot issues with CPU usage and execution time. However, it is important to note the difference in statistical significance between a peak, where there are many requests, and one with almost none. High CPU time and low execution time indicate lots of requests being handled successfully. High execution time without a change in CPU usage indicates a few very slow requests.
Visually detecting project health issues
The memory usage graph is also good for detecting other issues with your install. For a live environment, a tidy set of graphs is a sign of predictable resource usage.
Memory usage
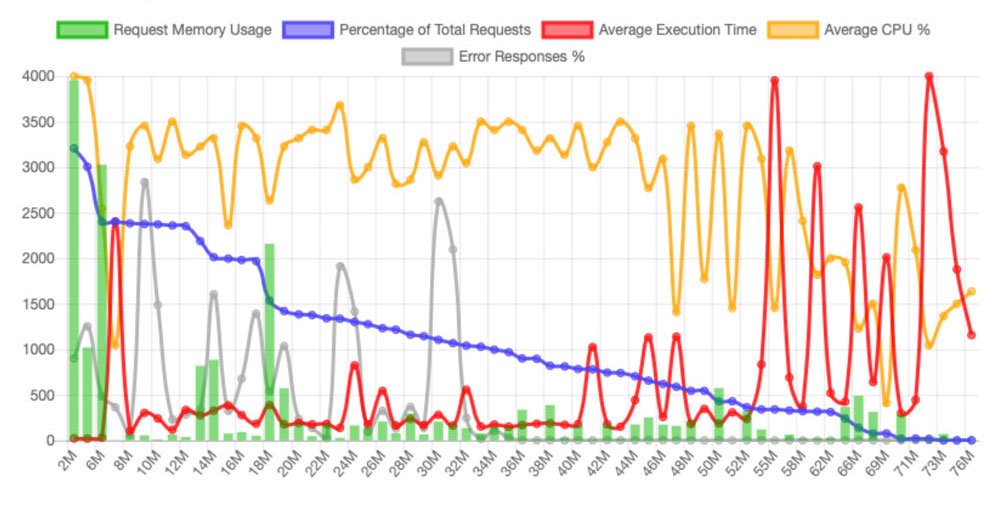
The above graph is painful. There are three problem flags:
Memory usage is spread out in the space between 2 – 76 MB. The 90 – 95% sweet spot is almost all the way to the right, somewhere around 60 – 66 MB!
Spikes in error responses are frequent. The gray graph shows requests with HTTP response codes 501, 502, 503, etc, for example at 24 MB and 30 MB.
Multiple memory usage peaks stand out along the way from left to right, for example at 14 MB and 18 MB. These could indicate popular uncached requests and possibly inefficient memory usage. Something worth optimizing.
You’ll also see fluctuations in average execution time and CPU.
Response code distribution
Another easy health check is the relative distribution of response codes. The analytics tool displays this information in five ways:
- Across total requests
- Average memory usage
- Average CPU usage
- Average execution time
- Over time
The first four are pie charts, and the last one is a bar chart. Looking at the distribution of response codes over time is especially useful for noticing operational events and trends. The chart below shows spikes in 404 and 500 responses.
Response codes

Looking at all HTTP requests
Looking at PHP-related requests will only get you so far. That’s why the Platform.sh Log Analyzer for PHP requests has a smaller sibling, called platformGoAccess.php. It wraps the GoAccess HTTP log analyzer and also outputs a portable HTML file, ready for your team. (You’ll have to install GoAccess first.)
Visions of the future
These two log analyzers were written as self-help tools for us at Pixelant. Open source is a core philosophy of ours, so we have licensed it under GPL. Such a project should be a common interest, and we would love your contribution as a fellow Platform.sh user. Check out the repository.
Tidying up the code base is one upcoming focus, but other ideas are surfacing on a daily basis. Here are just a few:
- Persisting logs locally, and implementing before/after comparisons
- Better scriptability, so you can automate the script and generate statistics at regular intervals
- Clicking on a point in a chart displays more relevant information, such as specific log entries
- Better calculation of recommended Platform.sh plan size
Check out Platform.sh Log Analyzer on Github
About the author
Mathias Bolt Lesniak lives outside of Oslo, Norway with his wife and two kids. He works with Platform.sh deployment at Pixelant and is an avid fan of TYPO3 CMS, and open-source contribution. You can reach Mathias @ProvenPudding.